Logs and monitoring
Where the logs are depends on how the server is hosted. The navigation menu shows the entries which fit your deployment.
Log files (all-in-one)
Navigation: Log files — route /logfiles
In the all-in-one deployment (and when running from source), the admin panel shows the log files of the server process itself.
The file list
The left column lists the log files with their last change time and size, newest first, and offers:
- a reload button to refresh the list,
- a download button per file, to get the whole file for a bug report.
The viewer
Selecting a file opens a terminal-style viewer on the right:
| Control | Effect |
|---|---|
| Live switch | Keeps appending new log entries as they are written |
| Refresh | Re-reads the file now |
| Filter | Shows only the lines which contain your text |
| Scroll to bottom | Jumps to the newest entry |
| Close | Closes the viewer and shows the full file list again |
Log levels are colour-coded, and the footer shows how many lines are displayed out of how many were read — the viewer reads the tail of the file, not the whole file, so a very large log stays fast.
Configuring what is logged
Navigation: Logging Configuration — route /logging-configuration
(administrators only)
Logging is configured in appsettings.json with
Serilog. In the
all-in-one deployment, you can edit it in the admin panel instead of editing the
file. The page shows the path of the file it edits, and offers two tabs:
| Tab | Effect |
|---|---|
| Log Levels | The default minimum level, and a table of levels per source. A source is the name of a logger — usually the full name of a class, like MUnique.OpenMU.ConnectServer.ClientListener — or a namespace like MUnique.OpenMU.GameLogic, which covers all loggers in it. The most specific source wins. |
| Advanced (JSON) | The whole Serilog section of the file, for everything the table doesn't cover, like sinks, output templates or filters. Invalid JSON is rejected. |
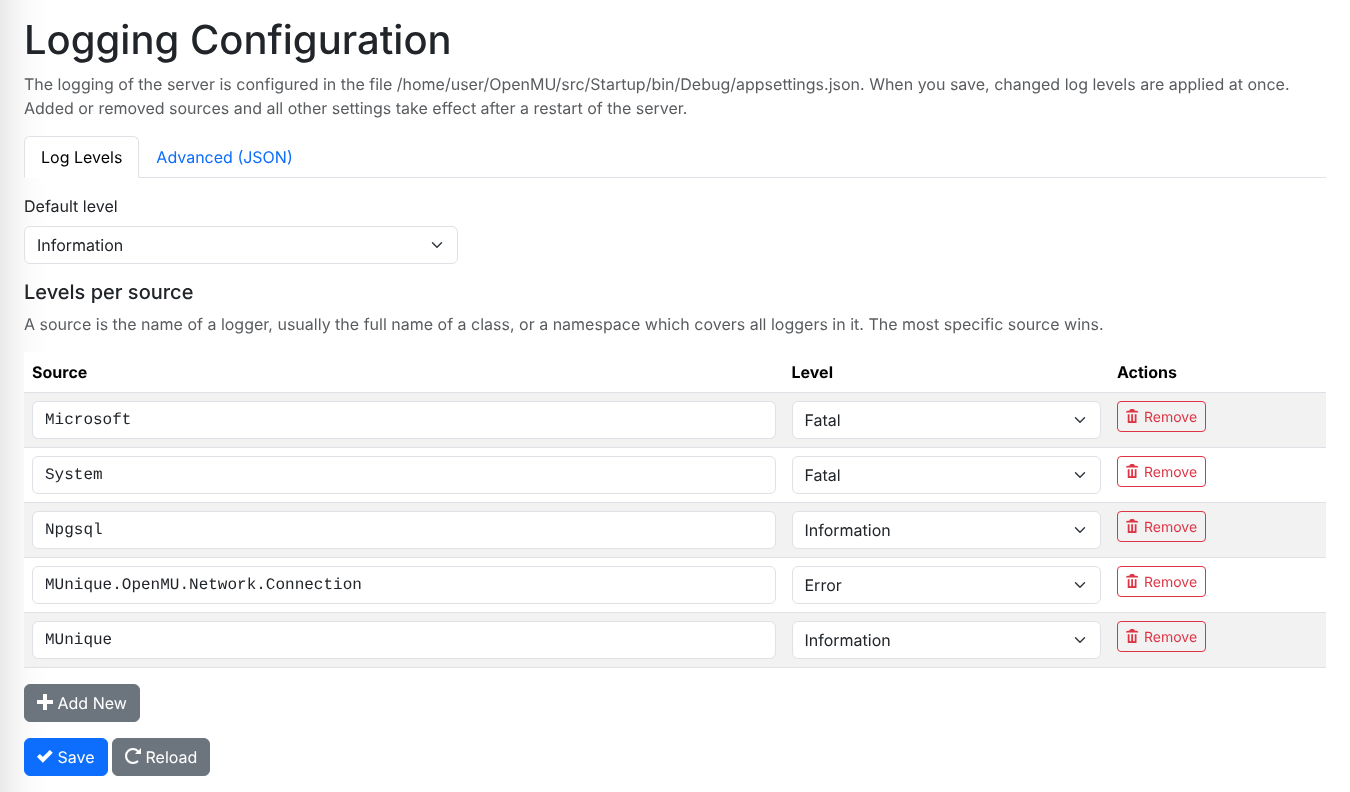
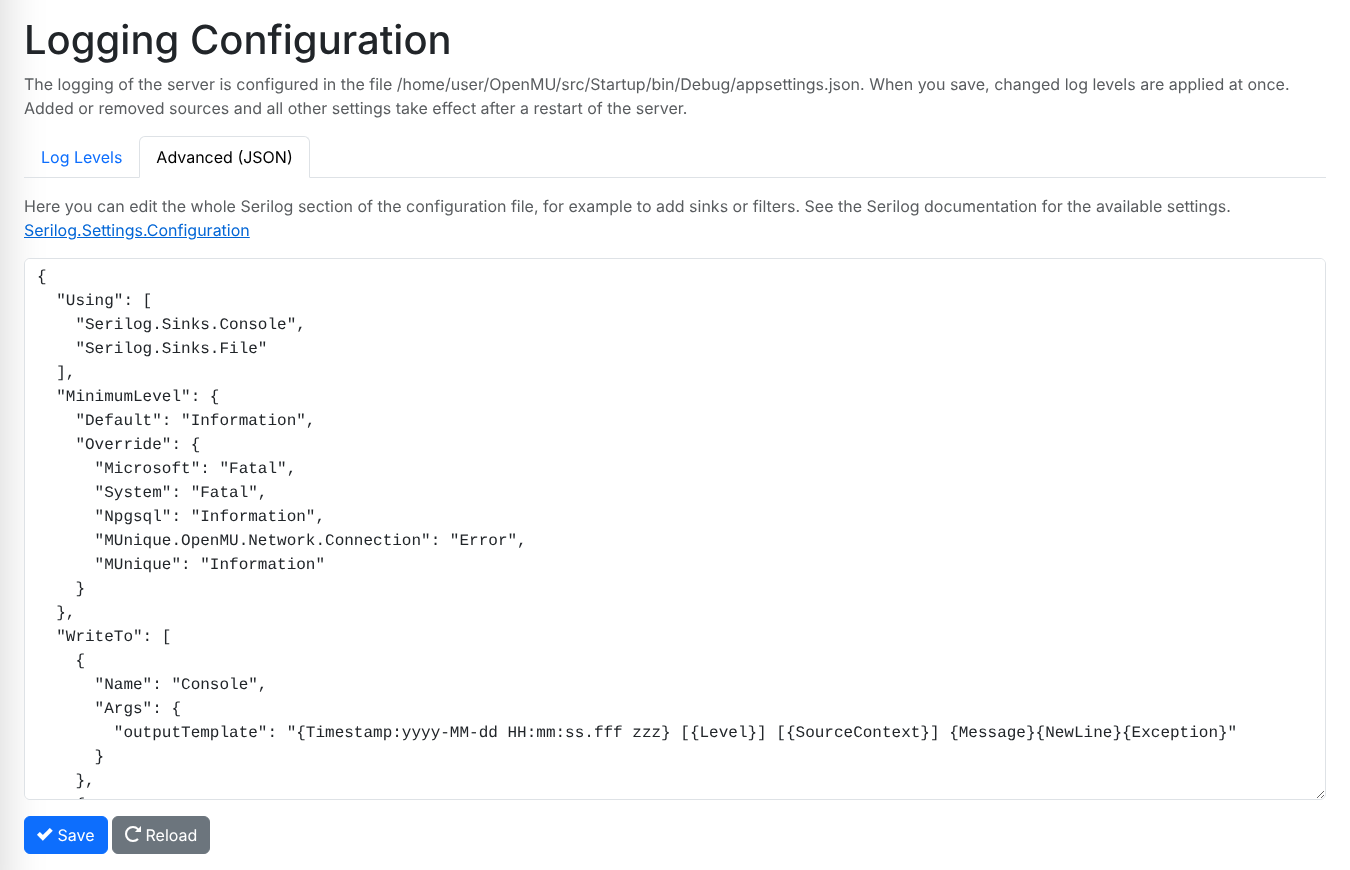
Save writes the file; the rest of appsettings.json stays as it is (comments
in it are lost, though). The server watches the file, so a changed level of the
default or of an existing source applies at once — no restart needed. A newly
added or removed source and everything else in the Serilog section take effect
after the next restart. Settings from environment variables or an
appsettings.<Environment>.json file override the file, so changing them here
has no effect.
In a docker container, the file lives inside the container: mount it as a volume, if a change should survive recreating the container.
The server makes good use of log scopes, so you can configure it to log only the actions of certain players, of a certain server, or of a certain logger. See Startup parameters.
Grafana (all-in-one, optional)
When the all-in-one deployment runs with its optional monitoring stack (with nginx or Traefik), the server additionally exports its logs, metrics and traces, and the navigation menu shows the Grafana entries described below next to the log files.
Distributed deployment
In a distributed deployment, the subsystems run in their own containers and their logs are collected centrally. The navigation menu therefore links to the tools instead of showing a log file page:
| Menu entry | Tool | What it is for |
|---|---|---|
| Logs | Grafana / Loki | Search the log entries of all containers |
| Metrics | Grafana dashboards (Prometheus) | Player counts, resource usage, throughput |
| Tracing | Grafana / Tempo | Follow one request through the subsystems |
All subsystems send their logs, metrics and traces with
OpenTelemetry (OTLP) to one backend container, which
is part of the distributed docker compose file. Grafana is served by the same
reverse proxy as the admin panel, under /grafana/.
Grafana uses the admin panel login: without being signed in to the admin panel, you're sent to its login page first, and signing out of the admin panel signs you out of Grafana, too. The role of the admin panel user decides what you may do in Grafana:
| Admin panel role | Grafana role |
|---|---|
| Administrator | Admin |
| Operator | Editor |
| Viewer | Viewer — can still search logs and traces |
This applies to the optional Grafana of the all-in-one deployment as well. Like the admin panel itself, Grafana is reachable without a login until the first user exists.
What to include in a bug report
If you report a problem in an issue or on Discord, the useful parts are:
- the OpenMU version or docker image tag, and the deployment you use,
- the game version the database was initialized with,
- the log around the time of the problem — download the file rather than copying a screenshot of it,
- what you did in the client or panel right before it happened.